
Many have asked this question when the days get hot and long. I get many calls wondering why an engine is not making “full power.” As the outside air temperature rises, an engine’s performance can take the brunt. How do we determine if your engine is performing like expected?
For years Pratt & Whitney Canada has produced ground-run engine performance charts. These charts have curves that take your OAT (outside air temperature) and field barometric pressure and convert them to “standard day” to determine engine performance. One issue that has popped up over the years is how the airframe restricts air into the compressor. We rely increasingly on airframe manufacturers to provide us with engine performance charts. These charts take the specific airframe inlet system and any filtration into account for calculations. This helps us get the best picture of your engine performance.
What is your first step if your engine is not making the power you think it should? I would verify the gauges in the cockpit. I want to make sure that they are giving accurate readings. I don’t want to make maintenance decisions on incorrect information. Simple testing of the torque system and temperature indicating system can be performed. Secondly, on the engine side, test the ITT (internal turbine temperature) system and the engine trim stick to ensure they are functioning correctly. Also, take a minute and see if something simple is going on. Is there evidence of any air leaks, such as an airline chaffed or fractured? Sometimes the corrective action can be very simple.
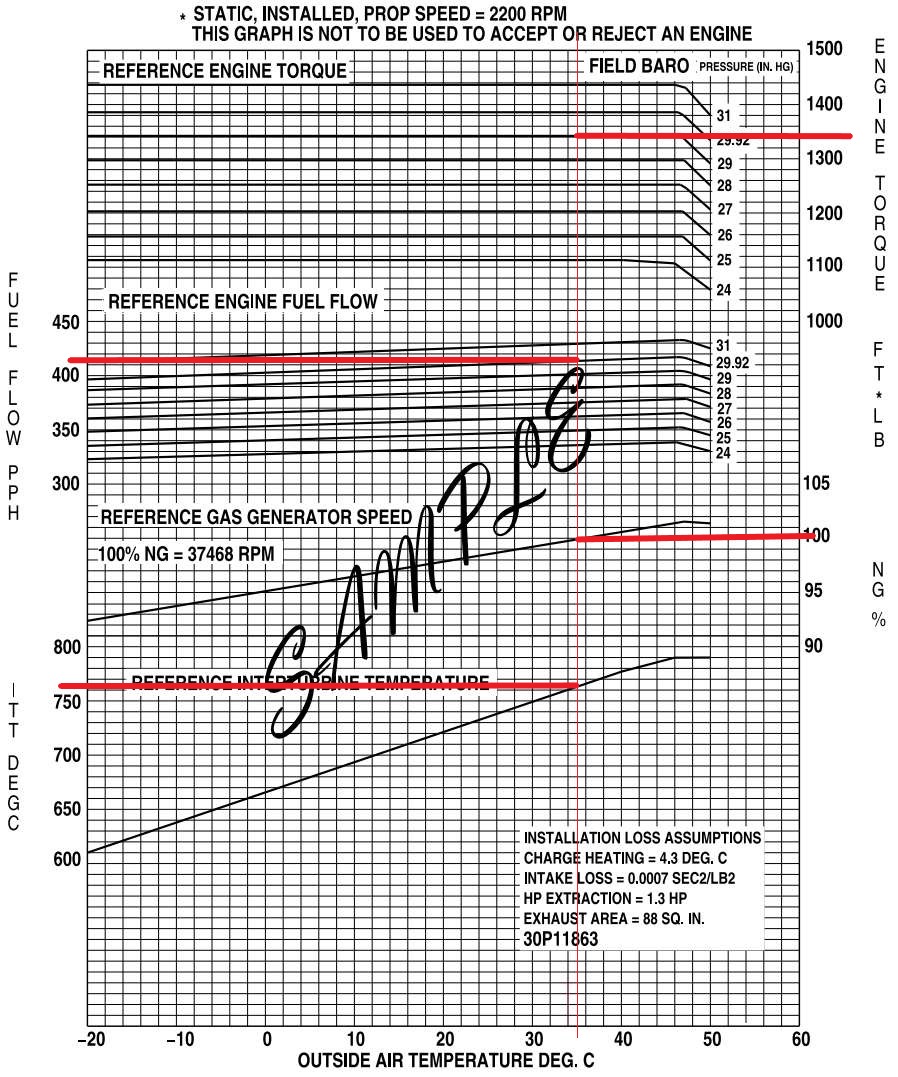
Once we know the systems in the airframe and the engine are functioning correctly, it is time to get down to business. Look at the ground performance chart, and across the bottom of most charts is the outside air temperature. We choose our current condition; for example, let’s choose 35 degrees Celsius today. That is 95 degrees Fahrenheit which represents a hot day here in Mississippi. For the sake of this article, I will use a performance chart for a PT6A-34AG. When you determine your engine performance, please use the chart for your airframe model provided by the aircraft manufacturer. I can now identify 35 degrees on the bottom of my chart and draw a line to the top of the graph. Notice that the 35-degree line now intersects curves for ITT (temperature), Ng % (compressor speed), fuel flow in pounds per hour, and torque in ft. lbs. Your specific airframe chart will provide you with this data in the same format as the gauges in your airplane. For example, some aircraft provide fuel flow in gallons per hour, and some use PSI for torque. If the chart you are using does not provide the data in the correct format, then it just takes some simple math to convert it.
Where the temperature for the day intersects the curves on the graph are now the targets we want to use to judge engine performance. This is a more accurate way to determine what the engine is doing than comparing it to another aircraft running nearby. For our example, 35 degrees OAT gives us a target on the chart for ITT of 765 degrees and Ng of 100%. We will also need the field barometric pressure for torque and fuel flow. Because it is close to where I live, I will use 29.92. That gives me a torque target of 1340 and a fuel flow target of 415 PPH. There are two other things to point out on my graph: prop rpm is 2200. We will need to know that when we do the performance run. It also says that the chart is not to be used to accept or reject an engine. We are not trying to determine the airworthiness of an engine. We are using this as a tool to measure how the engine is doing.
With our targets now in hand, we can do the engine performance run. Since we are producing power with the aircraft on the ground, we always use a tie down and secure the tail to it. We don’t want to have any incident; over time, I have known of prop strikes that have occurred during a ground performance run. Don’t be next.
Start the engine using your normal start-up procedures. Prop set correctly, run the engine up to the target torque, 1340 in our example. We use the torque as the constant; we must ensure we can get the work out of the engine. As we are going to torque, we watch the other gauges to make sure we do not go past the redline for all other parameters. Once the engine has stabilized at the target torque, we record the actual ITT, Ng, and fuel flow. This is the snapshot of the engine performance. We typically see that we are below the target numbers on those three parameters. We reference this as margin or cushion. If at the torque target your actual ITT is 735, it means that we have 30 degrees of temperature margin in the engine. The same applies to Ng. These numbers all provide clues about what is happening inside the engine. The engine maintenance manual directs us where to look if we suspect a problem.
What if all the parameters we are looking at are up above the targets? We start looking for air issues. Is the inlet restricting airflow into the engine? Is there a leak or bleed valve issue? We have caps and covers that allow us to disconnect some airframe attachments, such as cabin bleed air, and isolate the engine from the airframe. This helps pinpoint what we are seeing.
What if you see a change in ITT, either up or down? We have already verified the indicating system; perhaps it is a fuel nozzle issue. If Ng is up or down or fuel flow, there are helpful directions in the engine maintenance manual that can help determine what is going on. Many things can affect the engine’s performance. Foreign object damage, a crack in a case or airline, compressor turbine rub, vane ring, or nozzle issues all play a part in troubleshooting potential performance issues. These things must be investigated before you decide on changing a fuel control or splitting the engine to review or change something in the hot section. A lot of work can be done before spending big dollars.
If you suspect or feel that your engine is not producing the power that you are used to or expecting, take a moment and locate the ground performance chart. Run the engine to the target torque and record the rest of the parameters. Shut it down and discuss it with your mechanic or engine shop. With these numbers in hand, it helps us help you. You can also use these numbers to keep track of how your engine is running over time. Performance numbers are an easy way to monitor your engine. Being able to identify and discuss performance helps us to maintain it.
Robert Craymer has worked on PT6A engine and PT6A powered aircraft for the past three decades, including the last 25+ years at Covington Aircraft. As a licensed A&P mechanic, Robert has held every job in an engine overhaul shop and been an instructor of PT6A Maintenance and Familiarization courses for pilots and mechanics. Robert can be reached at robertc@covingtonaircraft.com or 662-910-9899. Visit us at covingtonaircraft.com.


